Oreguhnism
Really Active Member
Cats discriminating against the genetic advancement of birds, ie systemic,isnt that what you are against, the fucking horror.
Ps fuck cats

Cats discriminating against the genetic advancement of birds, ie systemic,isnt that what you are against, the fucking horror.
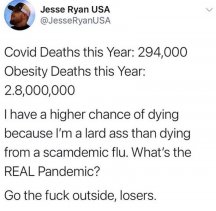
In case you didn't know the Democratic Governor of VA got Covid.
He wasn't invited anywayOr perhaps Governor Blackface is perpetrating a hoax designed to stop a Trump rally in Va a week ago.

I have a sneaky suspicion that this tweet was written a couple of weeks ago.
It was tweeted 2 hours agoI have a sneaky suspicion that this tweet was written a couple of weeks ago.
You miss my point.
The text was there the moment they decided a trip to the hospital was happening - blank left for timeI have a sneaky suspicion that this tweet was written a couple of weeks ago.
You miss my point.
It would be easy enough to prove. If he has/had it then he will have the antibodies in his system.People are conspiracy theorizing that he faked having it. Others that the democrats sent a plant in that was infected to try and start something.
Unintended consequences
This will show exactly how a business can still operate without all these restrictions, and if people do get sick it ain't as bad now that we know the remedy.
Obesity has been considered a major issue for awhile. While alot of the times it is personal choice and failure. the food industry coupled with the workload put on your average citizen doesn't exactly promote wellness in any aspect. Pisses me off that I could lose the ability to walk from a disease and have to compete with people that ate themselves into a chair.
and yet ......the food industry coupled with the workload put on your average citizen doesn't exactly promote wellness in any aspect.
| Life expectancy in the USA, 1900-98 | ||
| men and women | ||
| Year | M | F |
1900 | 46.3 | 48.3 |
1901 | 47.6 | 50.6 |
1902 | 49.8 | 53.4 |
1903 | 49.1 | 52.0 |
1904 | 46.2 | 49.1 |
1905 | 47.3 | 50.2 |
1906 | 46.9 | 50.8 |
1907 | 45.6 | 49.9 |
1908 | 49.5 | 52.8 |
1909 | 50.5 | 53.8 |
1910 | 48.4 | 51.8 |
1911 | 50.9 | 54.4 |
1912 | 51.5 | 55.9 |
1913 | 50.3 | 55.0 |
1914 | 52.0 | 56.8 |
1915 | 52.5 | 56.8 |
1916 | 49.6 | 54.3 |
1917 | 48.4 | 54.0 |
1918 | 36.6 | 42.2 |
1919 | 53.5 | 56.0 |
1920 | 53.6 | 54.6 |
1921 | 60.0 | 61.8 |
1922 | 58.4 | 61.0 |
1923 | 56.1 | 58.5 |
1924 | 58.1 | 61.5 |
1925 | 57.6 | 60.6 |
1926 | 55.5 | 58.0 |
1927 | 59.0 | 62.1 |
1928 | 55.6 | 58.3 |
1929 | 55.8 | 58.7 |
1930 | 58.1 | 61.6 |
1931 | 59.4 | 63.1 |
1932 | 61.0 | 63.5 |
1933 | 61.7 | 65.1 |
1934 | 59.3 | 63.3 |
1935 | 59.9 | 63.9 |
1936 | 56.6 | 60.6 |
1937 | 58.0 | 62.4 |
1938 | 61.9 | 65.3 |
1939 | 62.1 | 65.4 |
1940 | 60.8 | 65.2 |
1941 | 63.1 | 66.8 |
1942 | 64.7 | 67.9 |
1943 | 62.4 | 64.4 |
1944 | 63.6 | 66.8 |
1945 | 63.6 | 67.9 |
1946 | 64.4 | 69.4 |
1947 | 64.4 | 69.7 |
1948 | 64.6 | 69.9 |
1949 | 65.2 | 70.7 |
1950 | 65.6 | 71.1 |
1951 | 65.6 | 71.4 |
1952 | 65.8 | 71.6 |
1953 | 66.0 | 72.0 |
1954 | 66.7 | 72.8 |
1955 | 66.7 | 72.8 |
1956 | 66.7 | 72.9 |
1957 | 66.4 | 72.7 |
1958 | 66.6 | 72.9 |
1959 | 66.8 | 73.2 |
1960 | 66.6 | 73.1 |
1961 | 67.0 | 73.6 |
1962 | 66.8 | 73.4 |
1963 | 66.6 | 73.4 |
1964 | 66.9 | 73.7 |
1965 | 66.8 | 73.7 |
1966 | 66.7 | 73.8 |
1967 | 67.0 | 74.2 |
1968 | 66.6 | 74.0 |
1969 | 66.8 | 74.3 |
1970 | 67.1 | 74.7 |
1971 | 67.4 | 75.0 |
1972 | 67.4 | 75.1 |
1973 | 67.6 | 75.3 |
1974 | 68.2 | 75.9 |
1975 | 68.8 | 76.6 |
1976 | 69.1 | 76.8 |
1977 | 69.5 | 77.2 |
1978 | 69.6 | 77.3 |
1979 | 70.0 | 77.8 |
| ||
| | |
1998 | 73.8 | 79.5 |
Guessing better at keeping people alive..and yet ......
Life expectancy in the USA, 1900-98 men and women Year M F
Yea as you would expect. Doesn't mean its optimal or the quality of life reflected the age. Wait for the cancer spikes my generation will have.and yet ......
Life expectancy in the USA, 1900-98 men and women Year M F