ChiefRunningPhist
Drunk on Knowledge
Creating a custom SPD (Spectral Power Distribution, ie spectrum) can be confusing. This might help reduce some ambiguity in determining how much of a light is needed, or how much of a certain color is required to supplement proportionately, ie Far Red, UV, ect. Once you've entered in an approximation of your system it should be fairly easy to test a range of different colors and CCTs at various power levels and point source quantities to achieve the SPD in the proportionality you're after (amoung other things). There are various background curves to help guide and give reference.
Attached is an SPD simulator built in Excel. I use a 4K TV as my monitor so you may need to adjust your zoom setting in excel to match the monitor size you are using more closely.
v5.72.zip
- 04.12.21
- updated LM301H efficiency scaling.
v5.1.zip - older - has both low res & hi res files, but low res just removes some bold formatting, so its not much different.
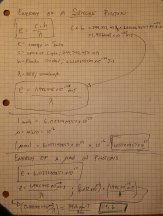
The spreadsheet is built based on this conversion constant...

^^^Talked about in more detail here...
CIE luminous functions were downloaded rather than digitized, the McCree yield curves were digitized. UVI is based upon a digitized erythemal function.
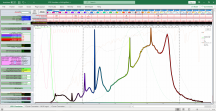
SPD Simulator v5.6 screenshot...

How I digitize graphs...
*up to 7,000 data points now
v5.1 run through video...
Good luck!
Attached is an SPD simulator built in Excel. I use a 4K TV as my monitor so you may need to adjust your zoom setting in excel to match the monitor size you are using more closely.
v5.72.zip
- 04.12.21
- updated LM301H efficiency scaling.
v5.1.zip - older - has both low res & hi res files, but low res just removes some bold formatting, so its not much different.
The spreadsheet is built based on this conversion constant...

^^^Talked about in more detail here...
SPD
What's up guys, just starting a thread dedicated to SPD. Ill start by adding these 3 figures... All measurements were with 450μmol/j constant canopy intensity. Each light source in it's own tent. Started out with 16 plants per light source and then dropped to the best 9 to flower per tent...
chuckersparadise.com
CIE luminous functions were downloaded rather than digitized, the McCree yield curves were digitized. UVI is based upon a digitized erythemal function.
SPD Simulator v5.6 screenshot...

How I digitize graphs...
v5.1 run through video...
Good luck!
Attachments
-
3.5 MB Views: 47
-
1.8 MB Views: 30
Last edited:
